OperisAI
Reimagining process intelligence via insight-led storytelling

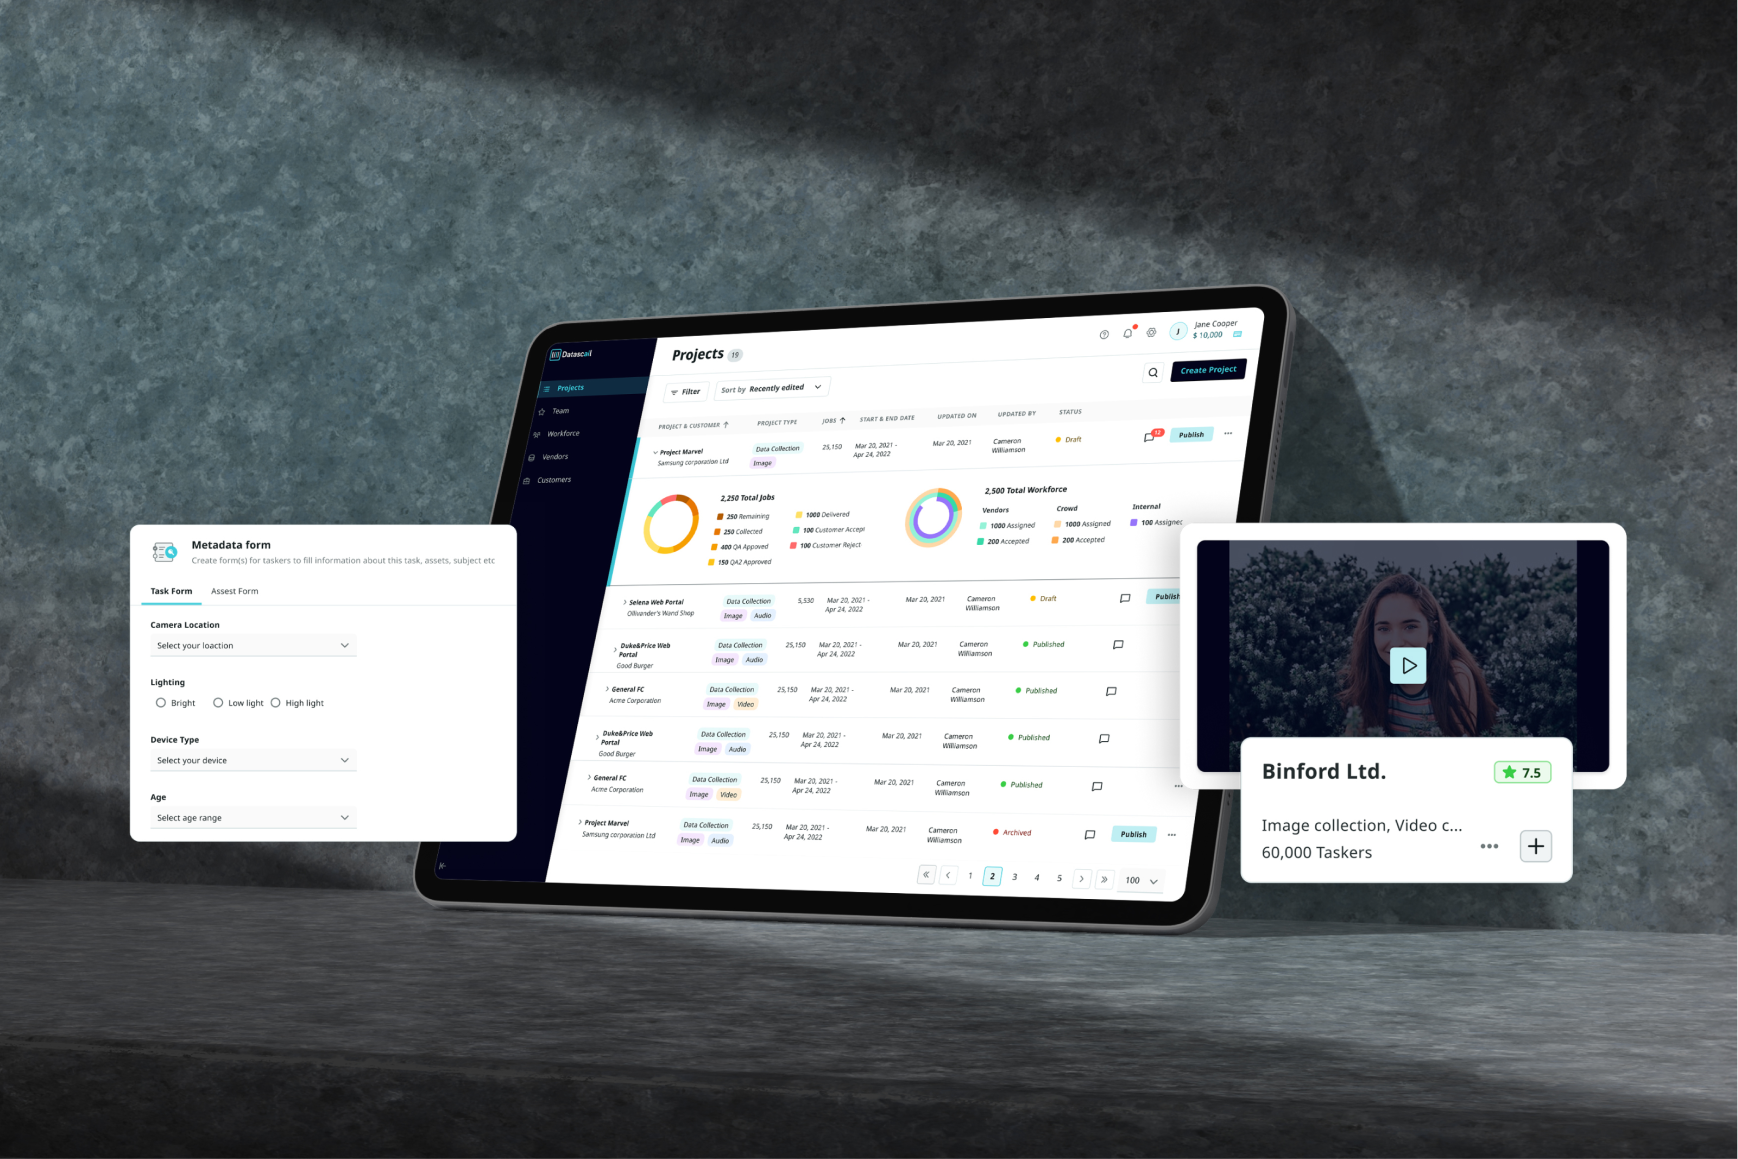
Aubergine partnered with OperisAI (anonymized) to transform complex process intelligence into actionable and insight-led stories that drive user action. The engagement focused on defining a clear product strategy, building a scalable design system, and redesigning productivity and analytics frameworks to improve operational clarity.
By shifting OperisAI’s narrative from raw data presentation to solution-first storytelling, we enabled users to understand deviations. This clarity helped identify inefficiencies and act decisively, thus driving better outcomes across enterprise operations.
Enabled process intelligence that delivers multi-million dollar value for enterprises

faster workflow mapping
faster insight generation
performance view
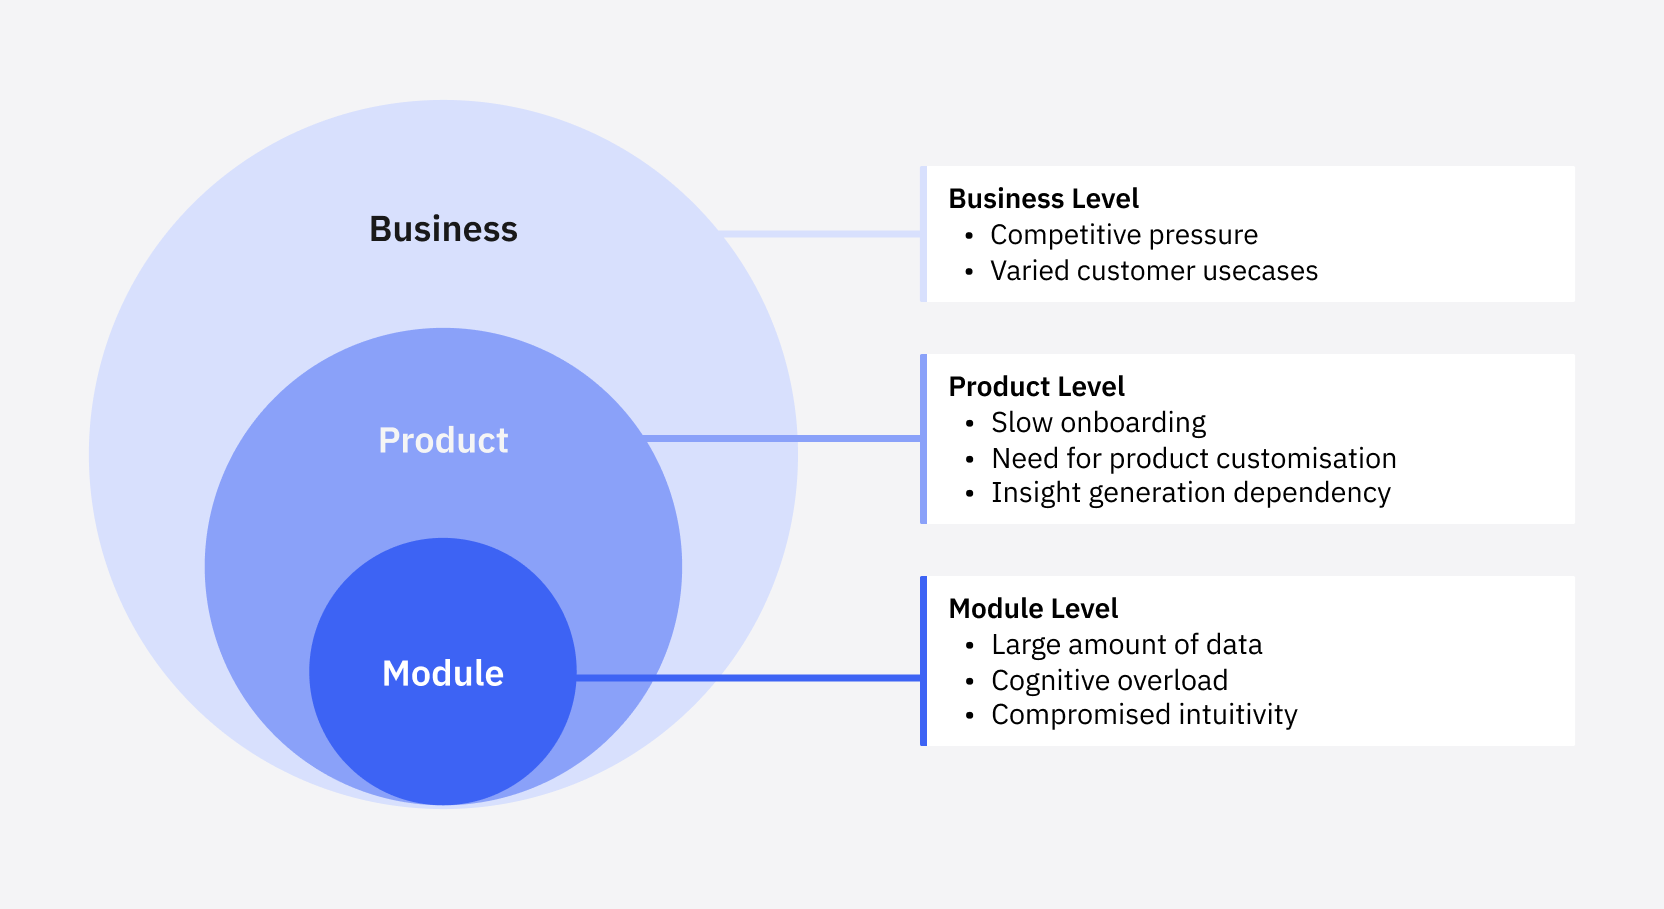
Unstructured layouts made it hard to understand flows and identify deviations
Inconsistent layouts and scalability issues limited insight formation
Fragmented navigation and redundant visuals disrupted comprehension
Improve operational clarity through structured insights
Reduce inefficiencies caused by fragmented workflows
Enable confident decision-making with contextual data
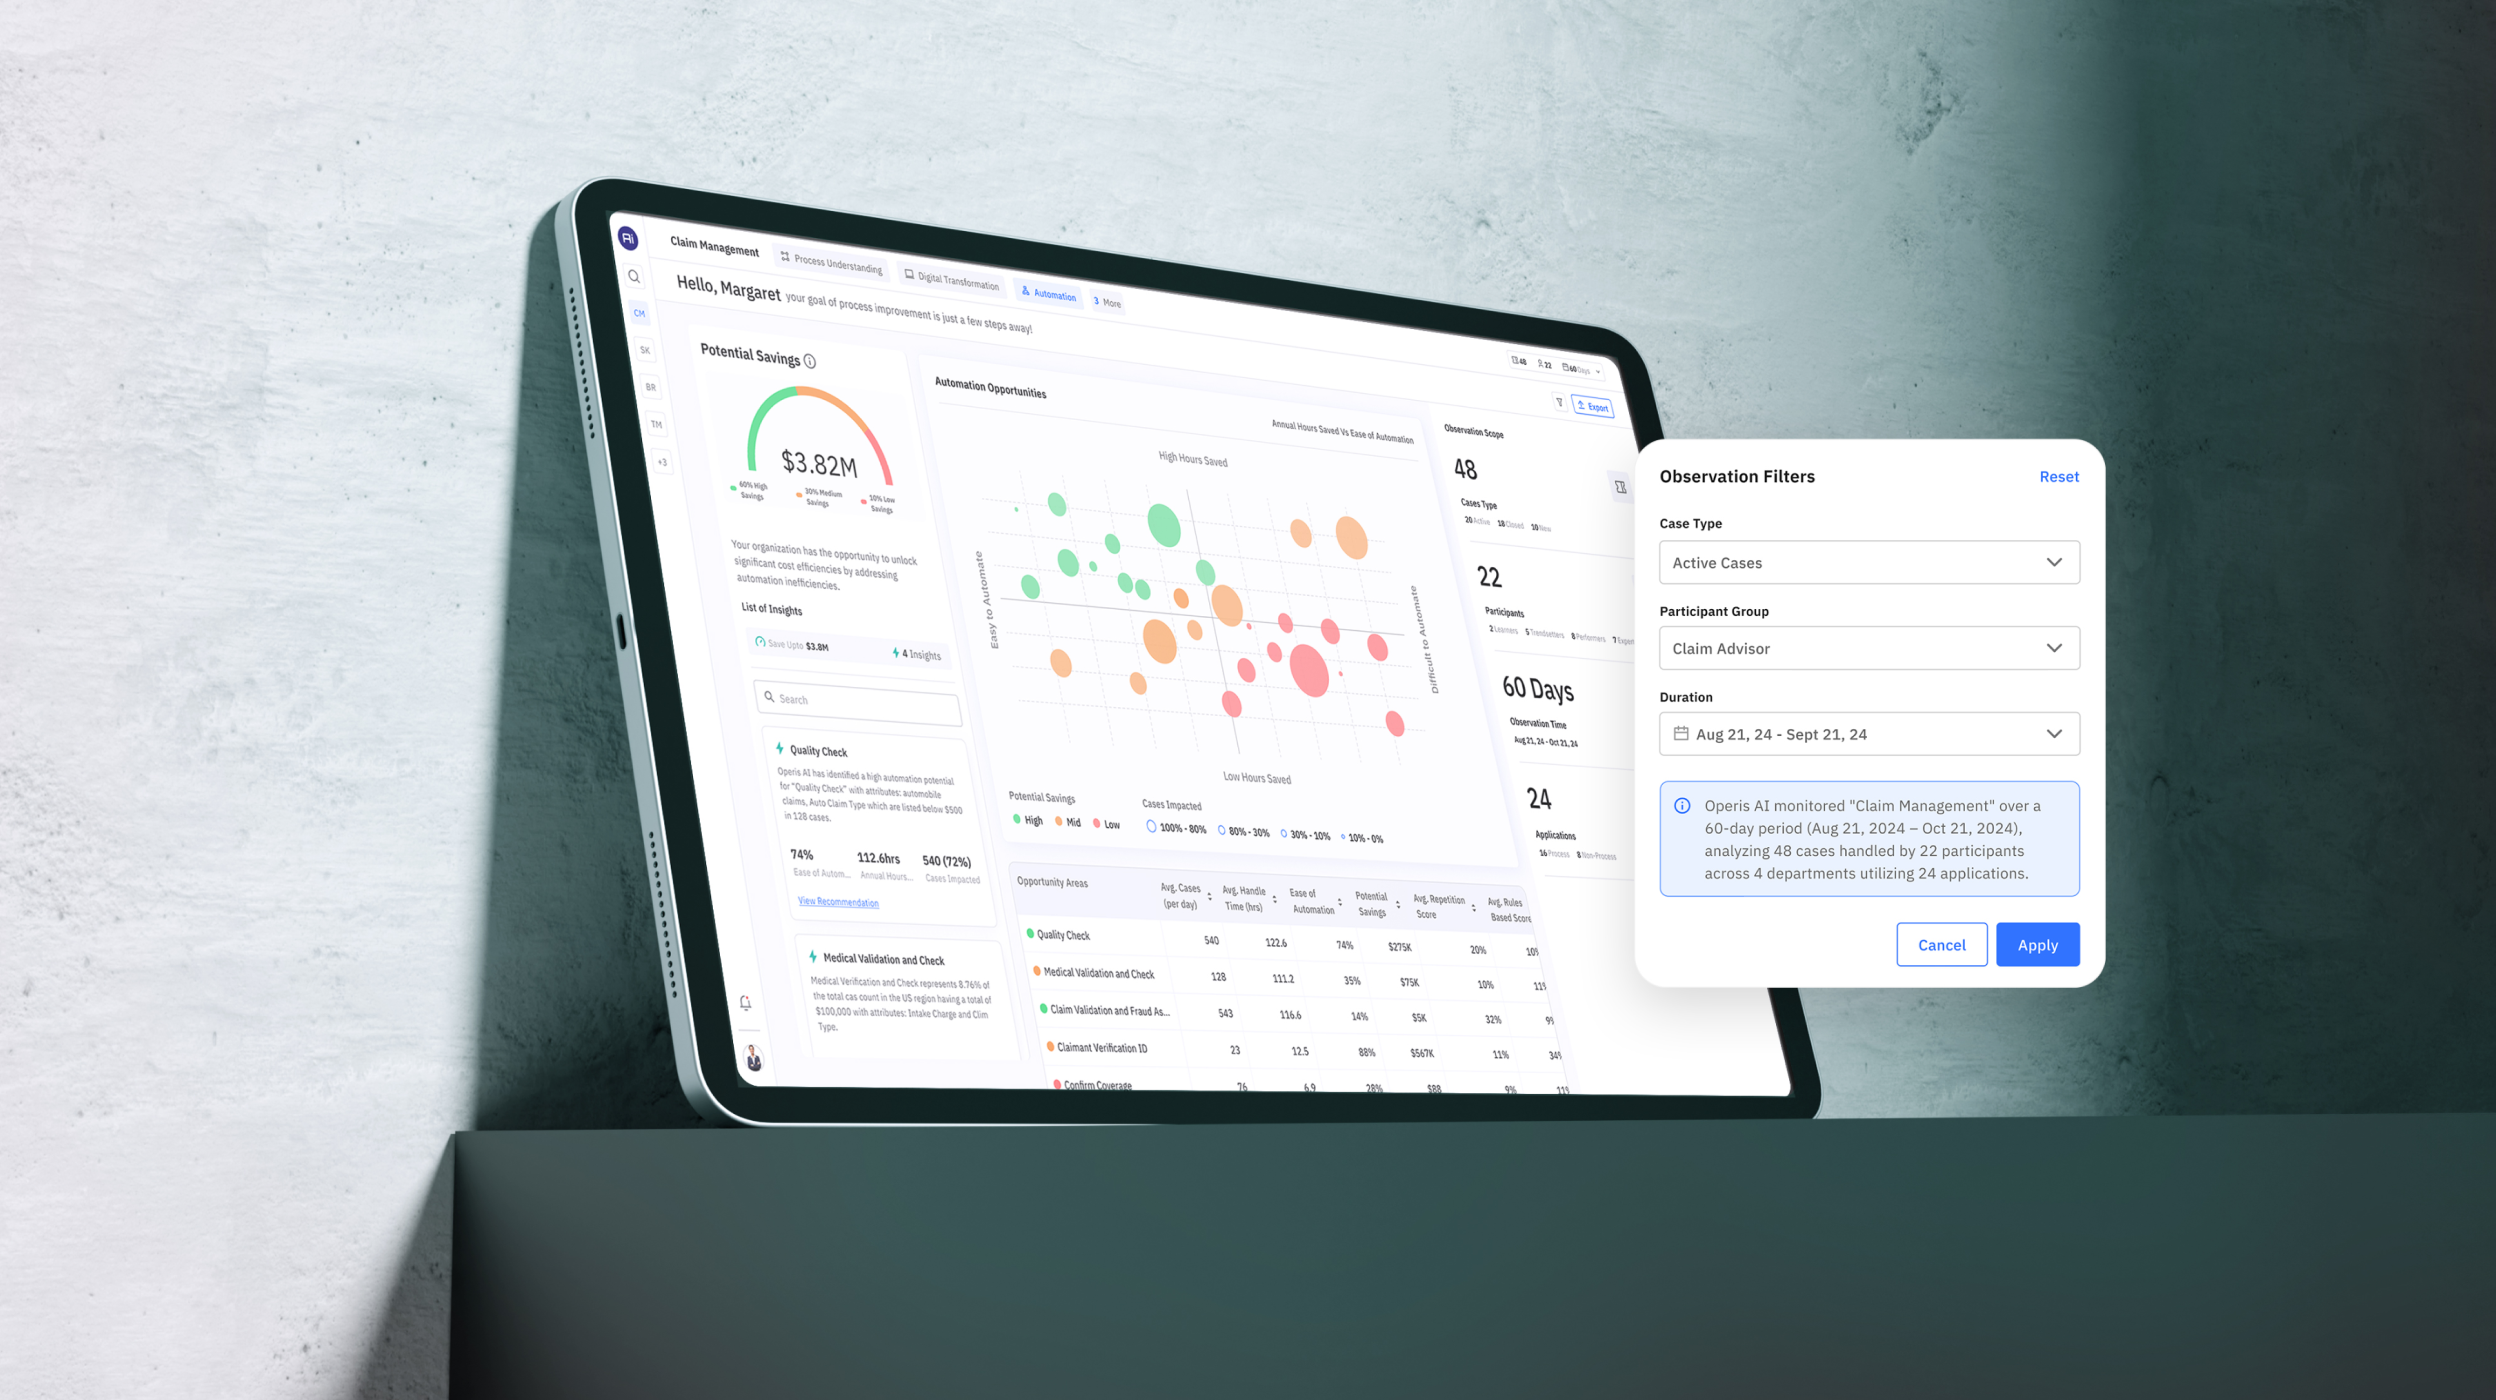
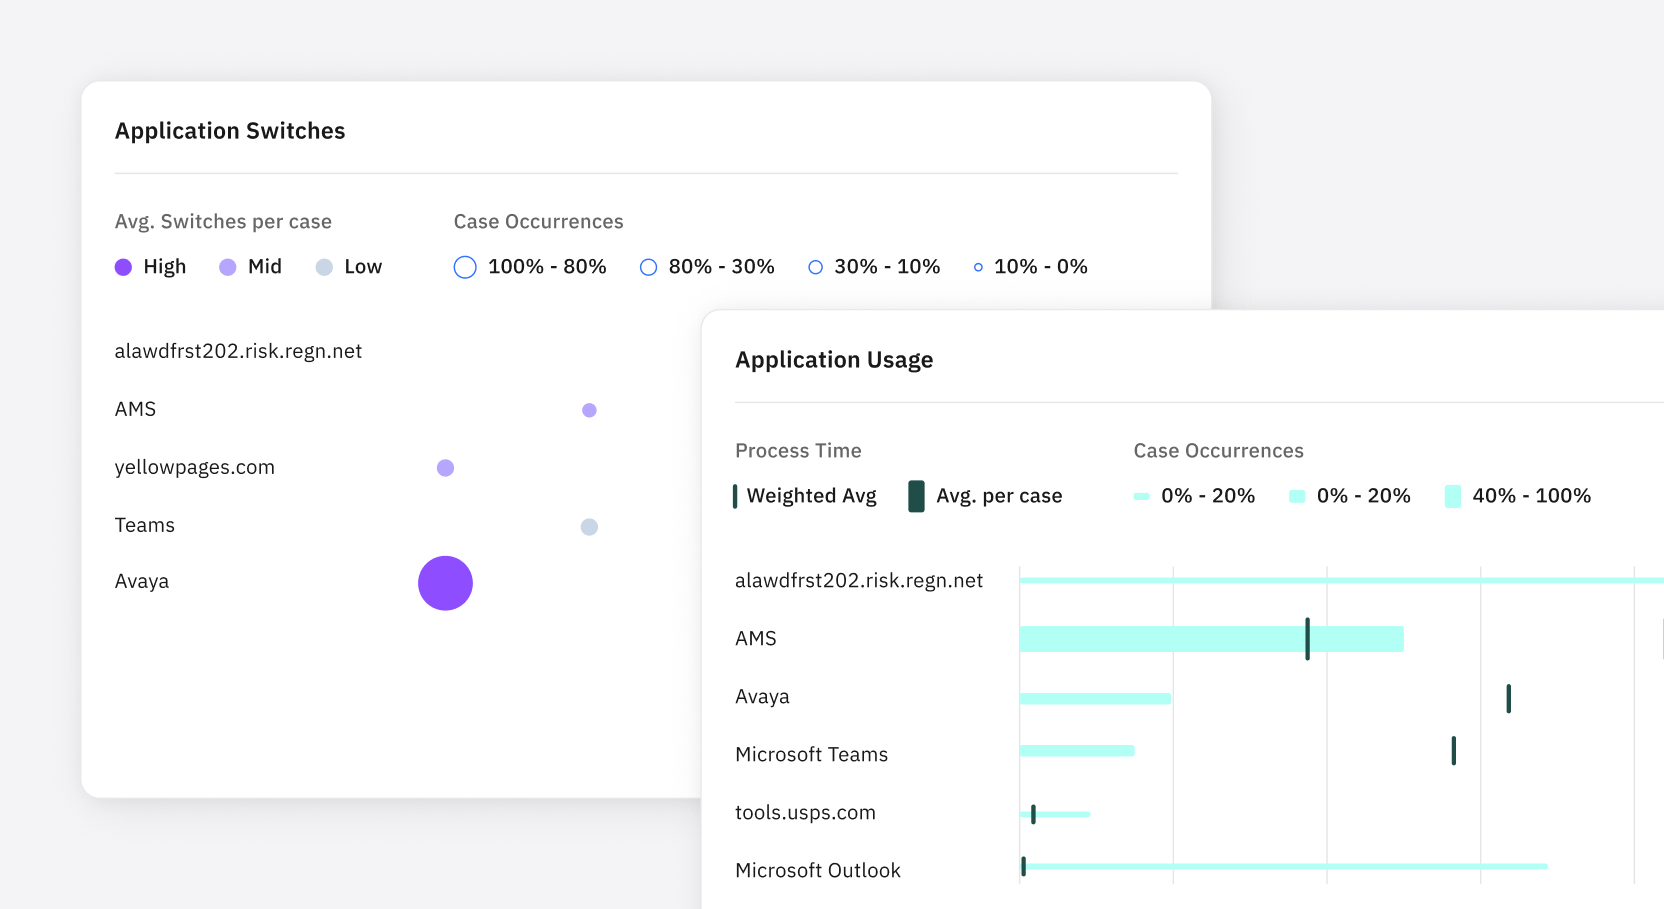
To address challenges in process comprehension, we redesigned OperisAI’s process map visualisations to provide clear structure and context. Information was condensed and organised into logical paths. This helped users quickly understand end-to-end workflows and pinpoint deviations from standard operating procedures.

Consistent colour coding and contextual highlighting were introduced to guide attention to critical moments within the process. By interconnecting related data displays, users could move seamlessly between high-level overviews and detailed insights without losing context.
The redesign significantly improved readability and efficiency, reducing analysis time and supporting quicker operational decisions.
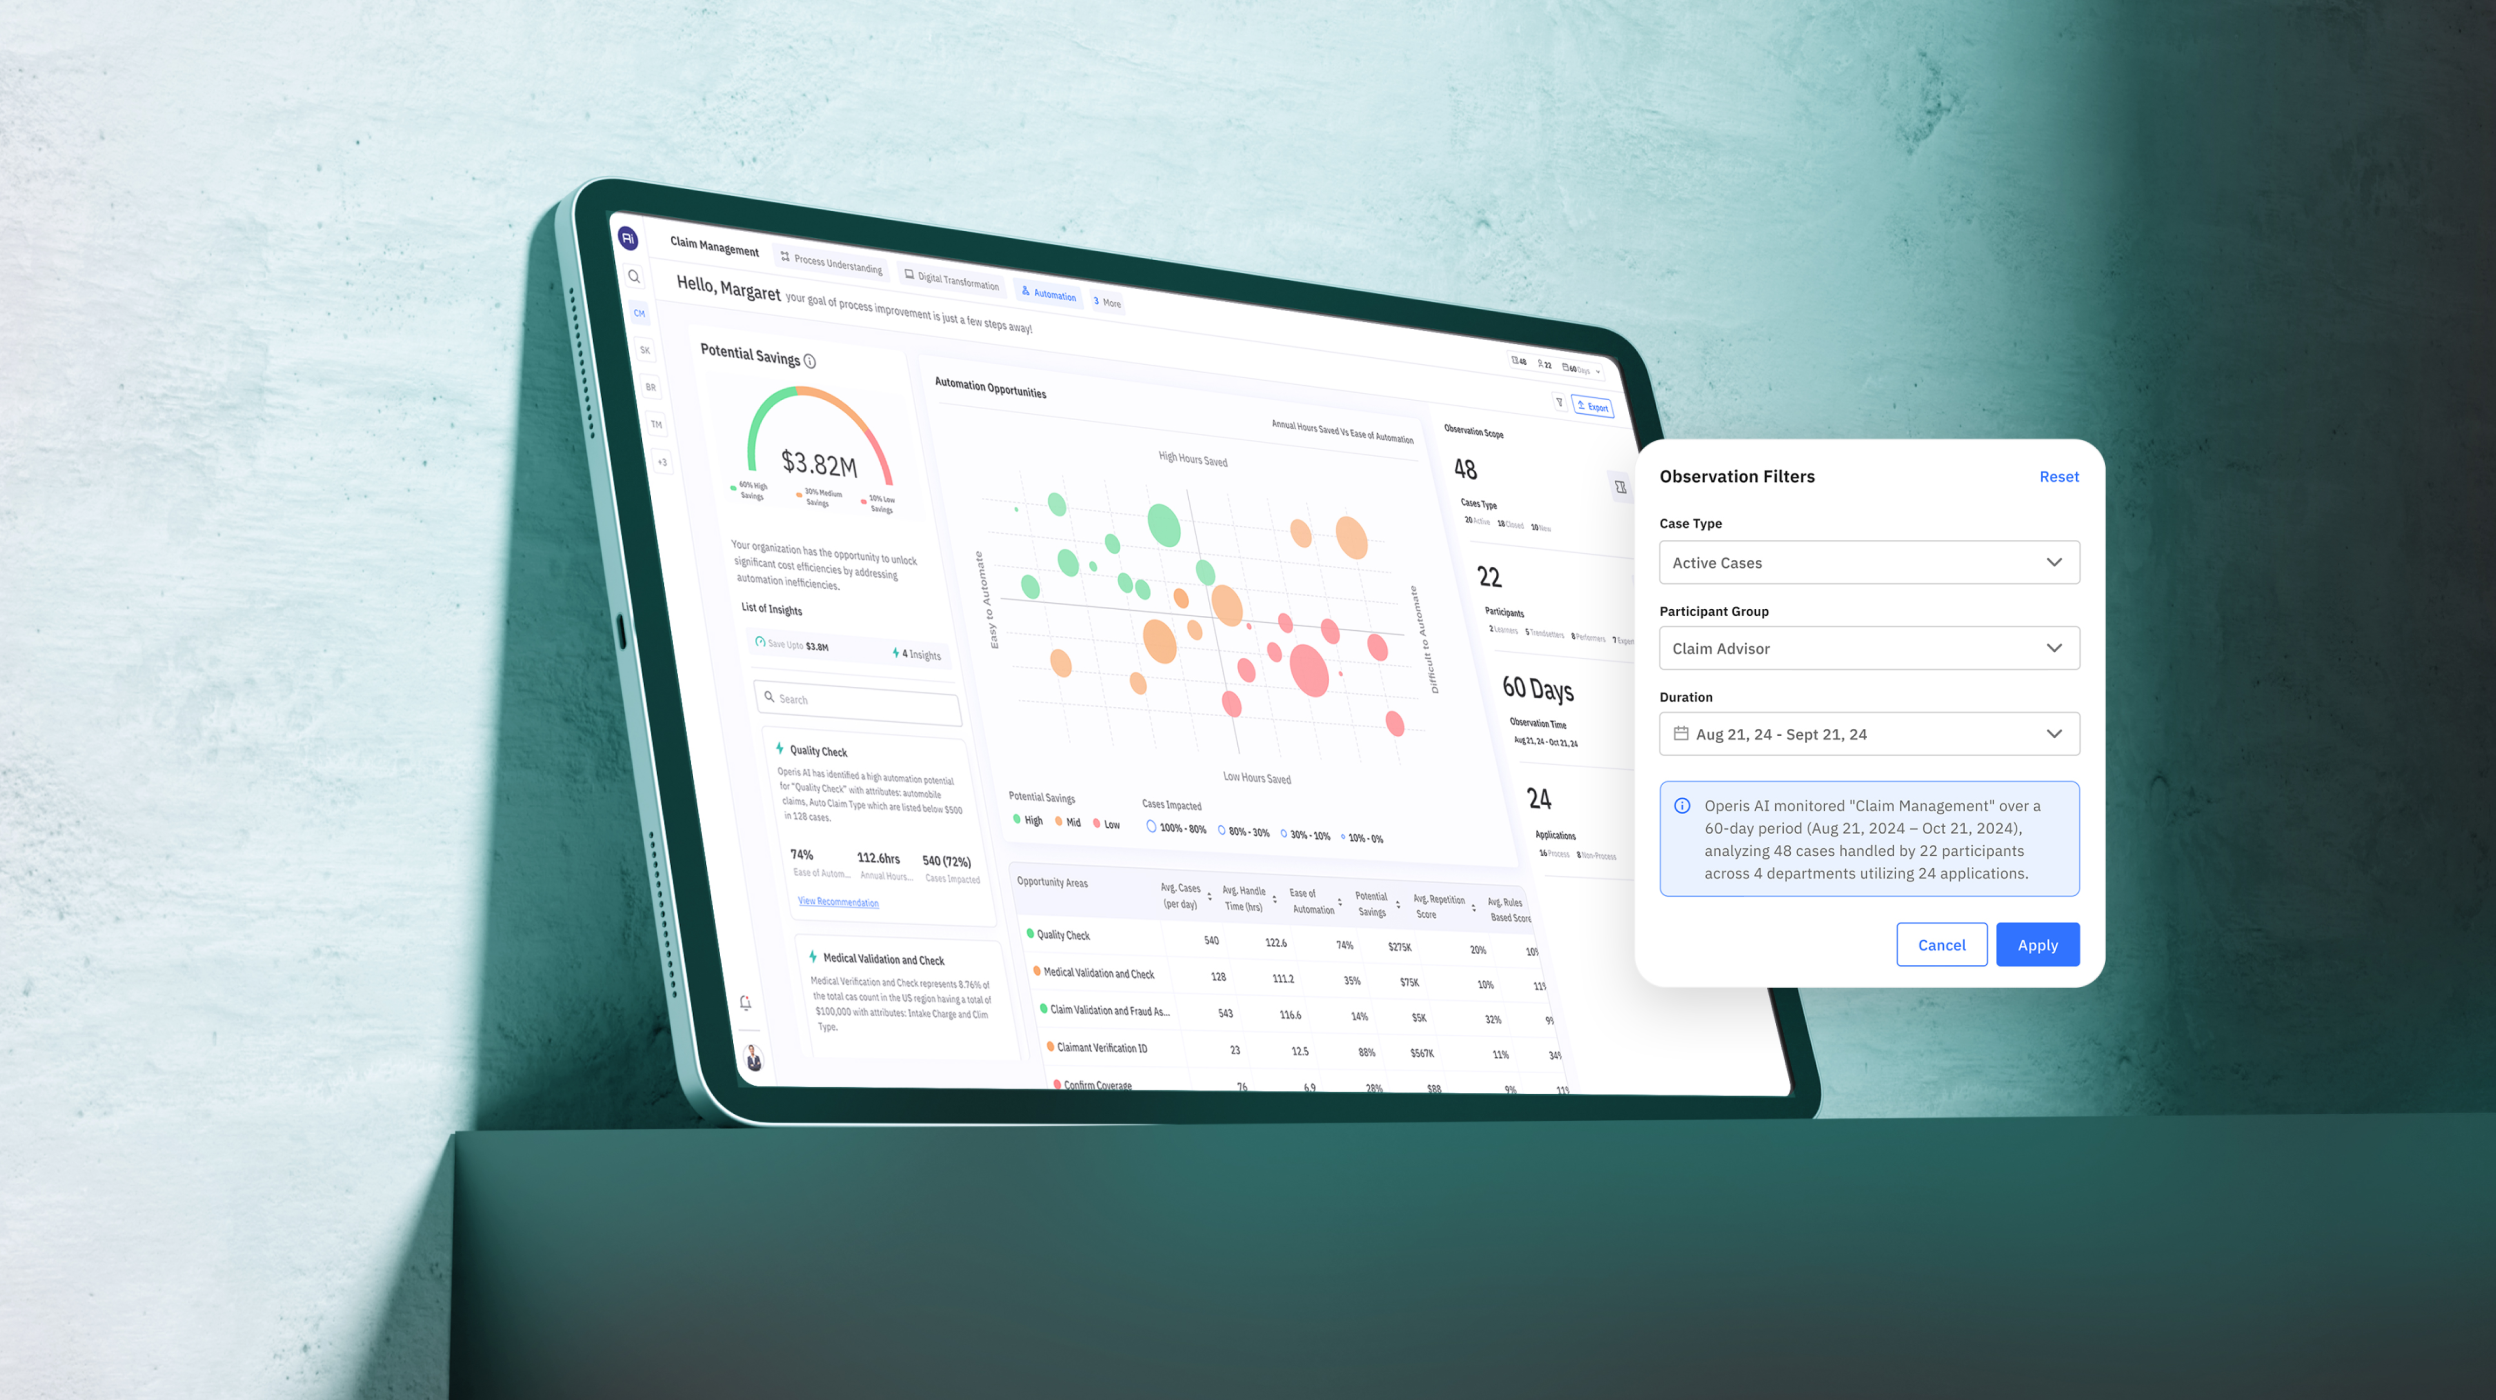
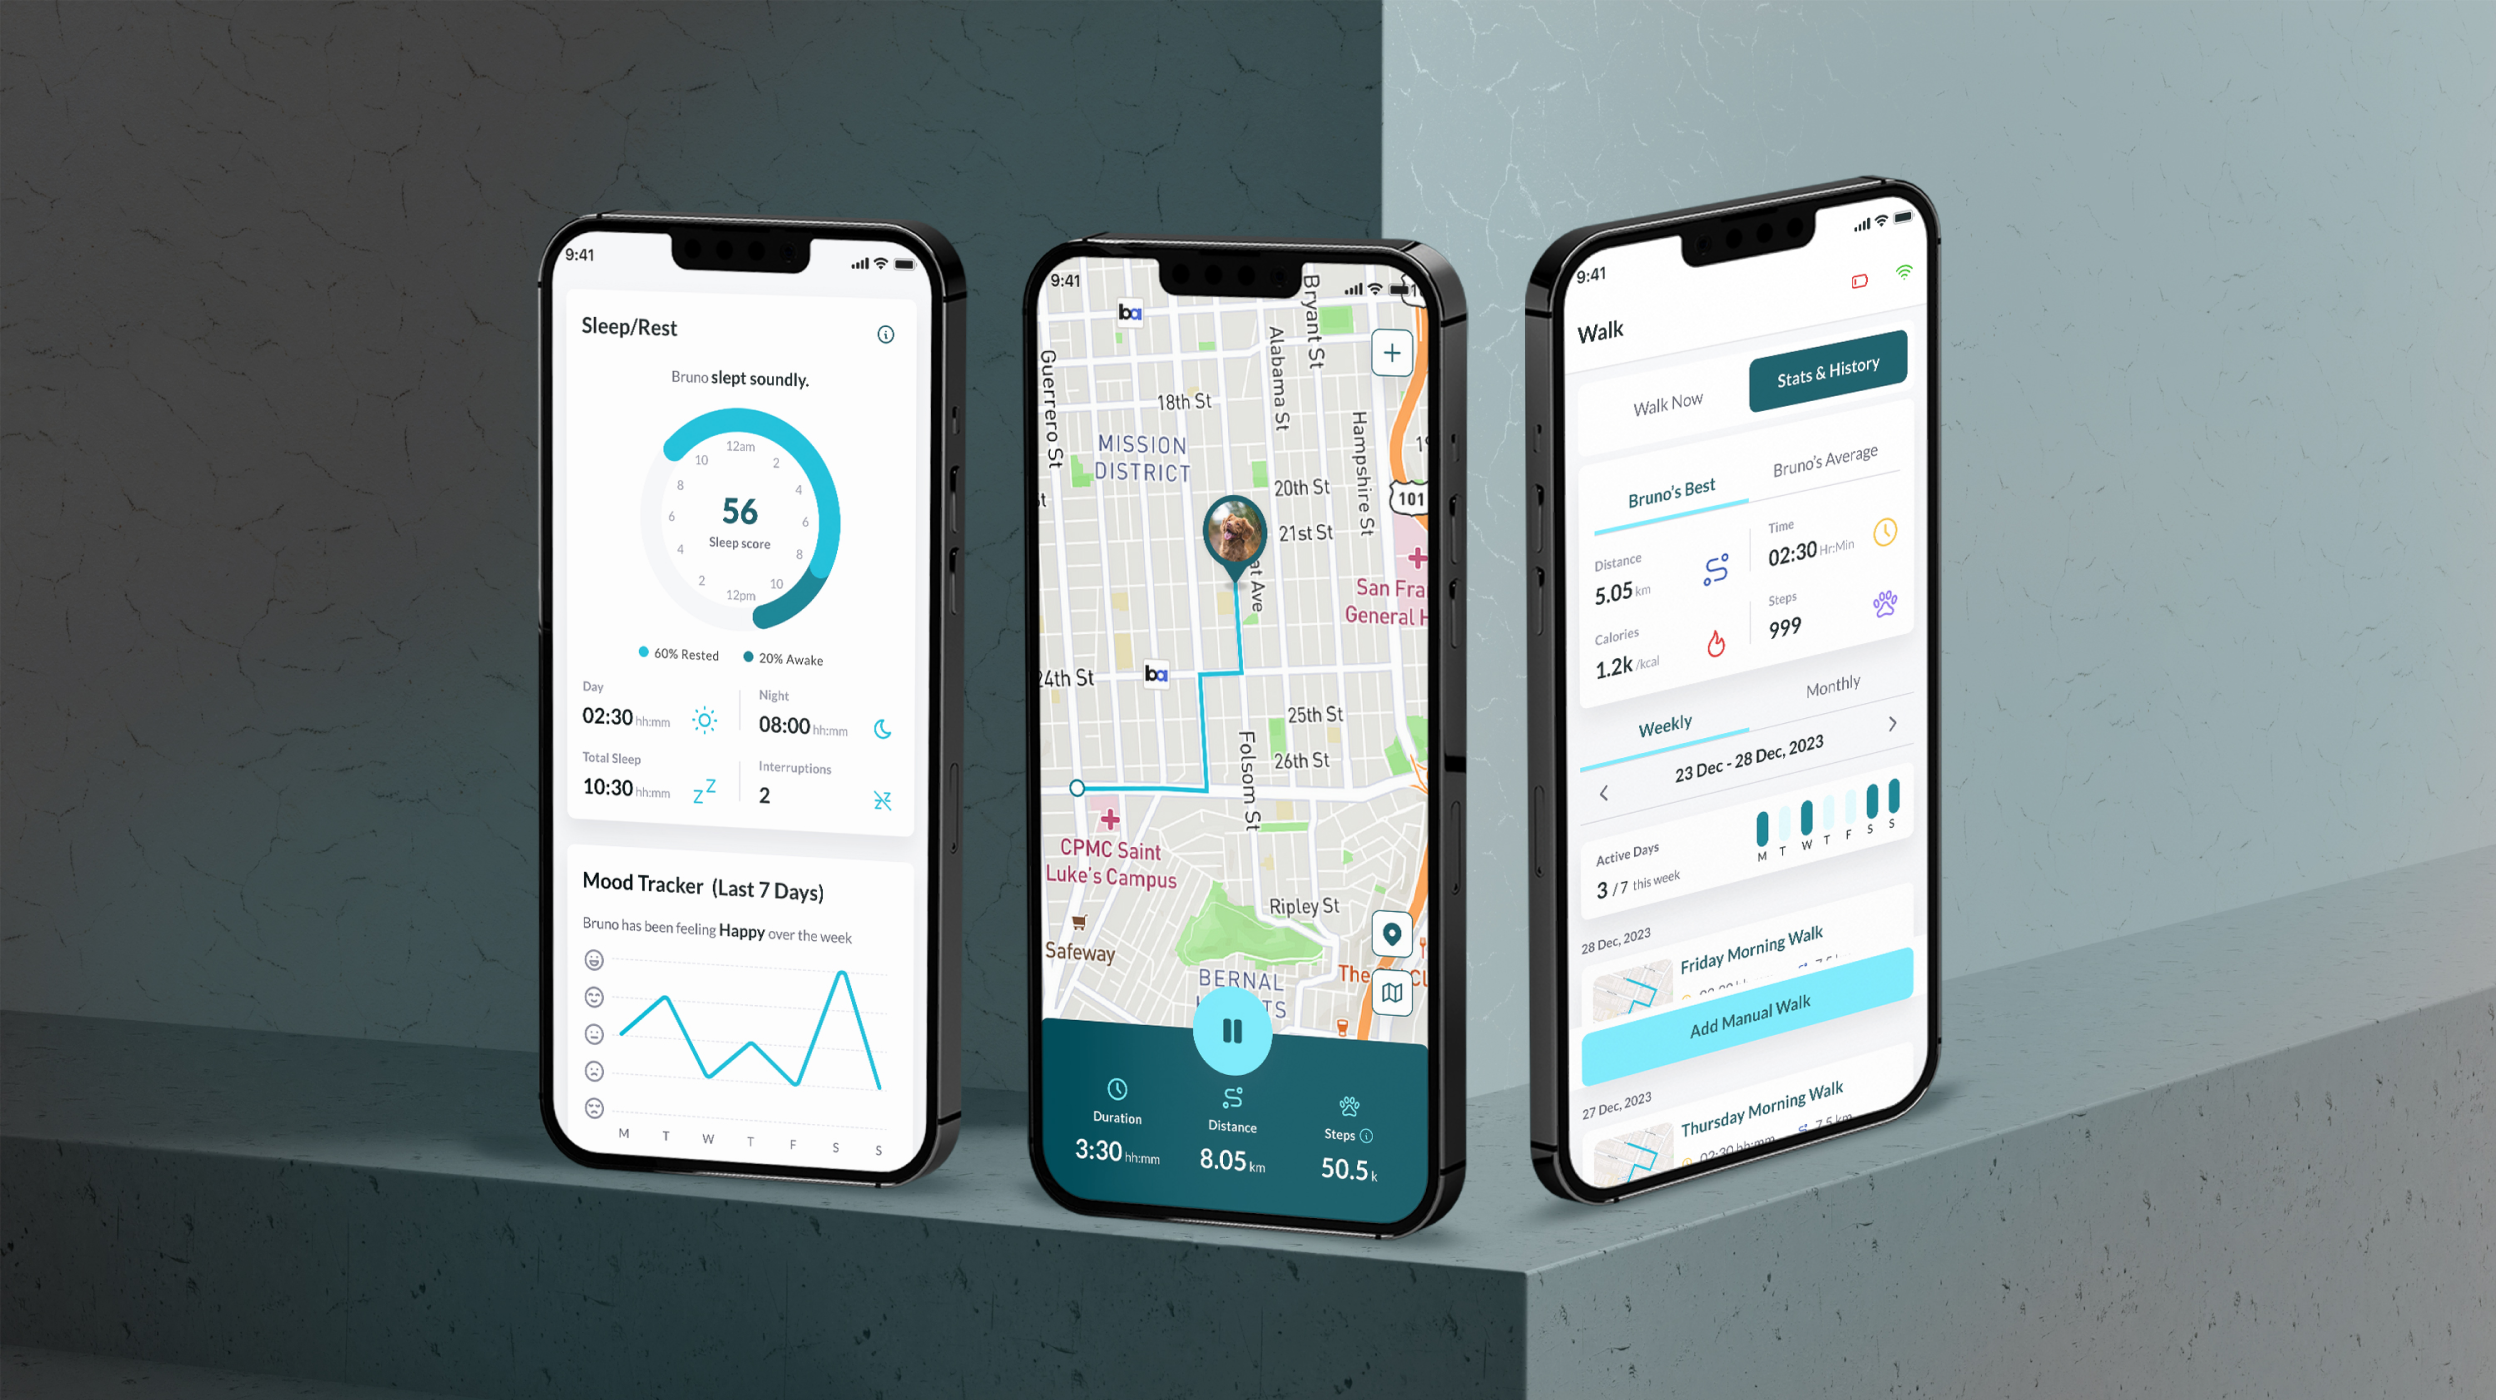
We restructured OperisAI’s analytics experience to help users gain contextual understanding of their data. Instead of isolated metrics, data was presented through combined tables and drill-down graphs that allowed users to explore insights progressively.
Layouts were designed to scale across datasets while maintaining consistency, ensuring users could compare metrics without confusion. Strategic use of colour and highlighting helped direct attention to anomalies, trends, and key indicators.
By anchoring data in context, users could move beyond surface-level metrics and uncover meaningful insights that directly informed operational improvements.
To address disjointed data flows and context loss, we introduced a storytelling framework that presents insights before the data. This solution-first narrative helps users understand outcomes immediately, reducing cognitive overload and improving engagement.
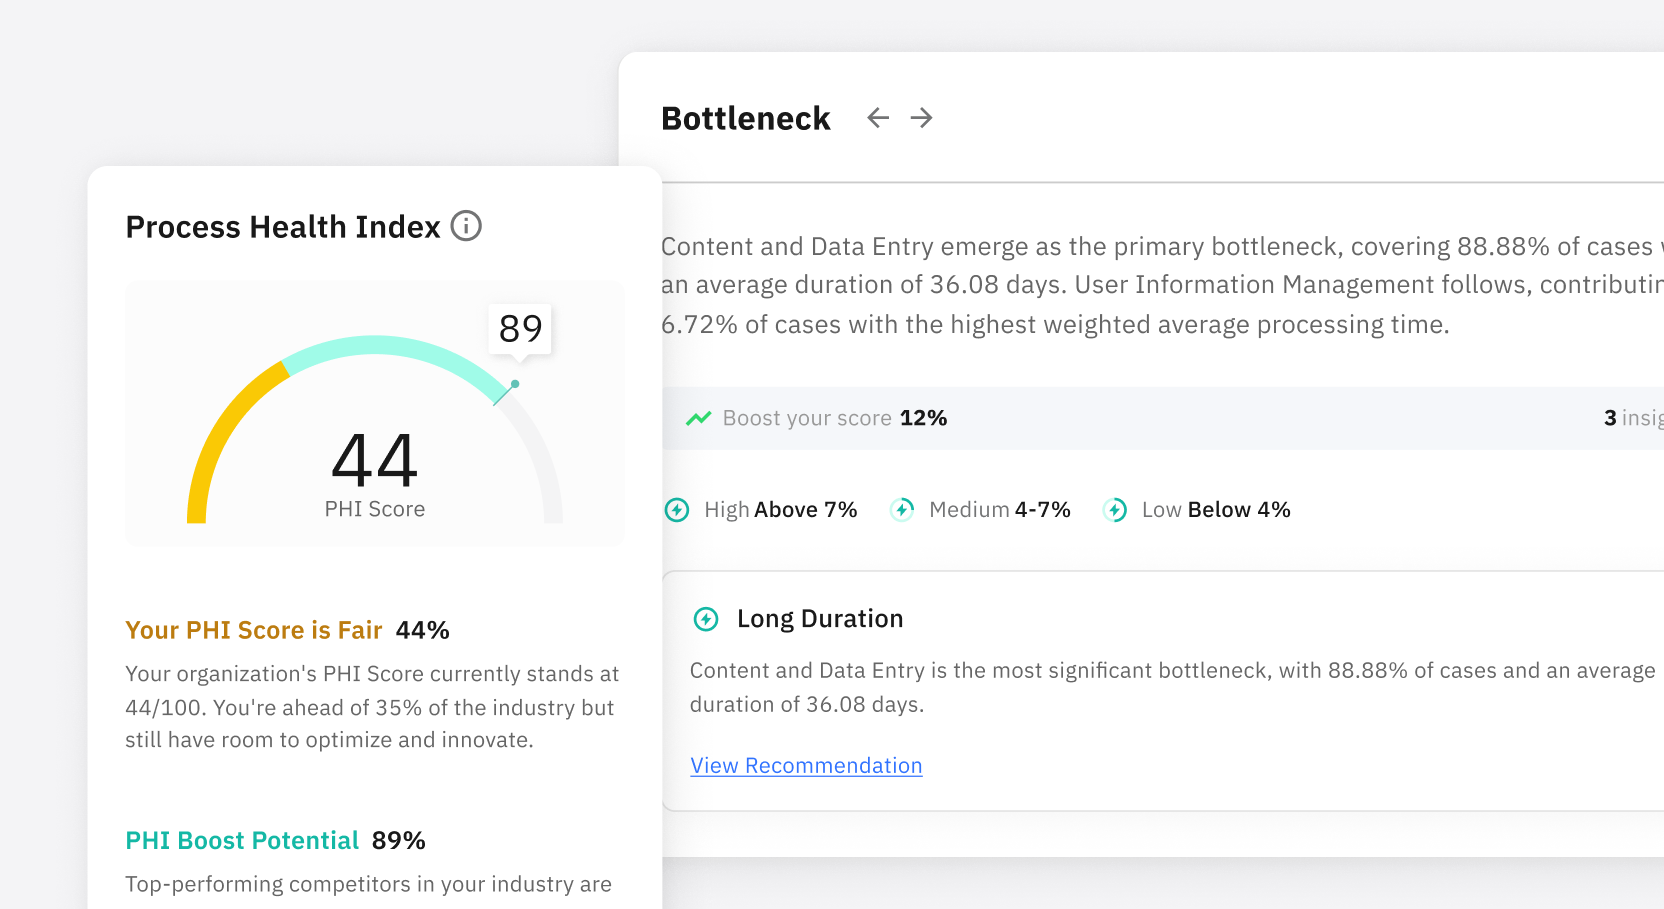
Each insight is supported by data, allowing users to explore the “why” behind the recommendation without breaking flow. Complementing this, we redesigned navigation using role-based lenses that align views to specific objectives and responsibilities.
Together, storytelling and navigation create a cohesive experience where users can easily connect data, problems, and actions. This helps restore trust, improve discoverability, and enable confident, informed decisions.
faster workflow mapping
faster insight generation
performance view
.webp)